Formal insolvencies
Formal insolvency statistics are compiled by the Insolvency Service every quarter and can be found here. The statistics below are taken from Companies House filings and due to timing differences will slightly different to those produced by the Insolvency Service.Liquidations
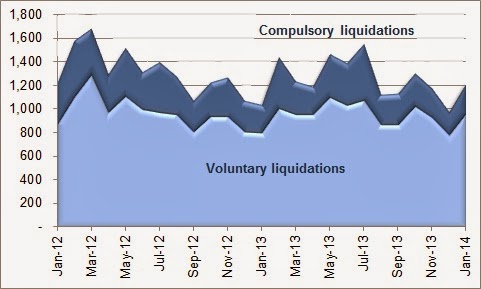
During the first half of 2013 the level of liquidations appeared to be on the increase however this trend appears to have reversed in the latter part of the year.
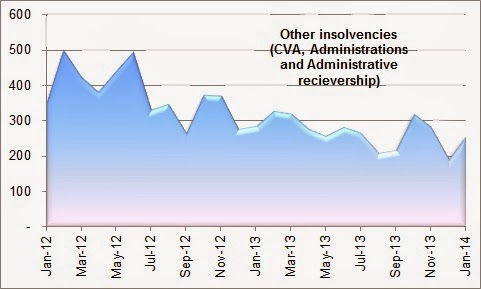
Other types of insolvency
The volume of other insolvencies including Company Voluntary Arrangements ("CVAs"), Administrations and Recieverships is shown below. The underlying level of these rescue procedures is lower than recent historic levels.
Other indicators
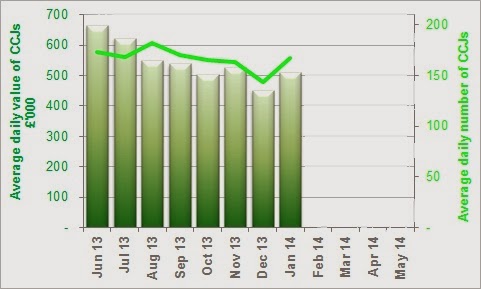
County Court Judgements
This graph shows the average daily number and value of CCJs issued against companies (including LLPs) in the UK where the company is not subject to an insolvency process or dissolved.
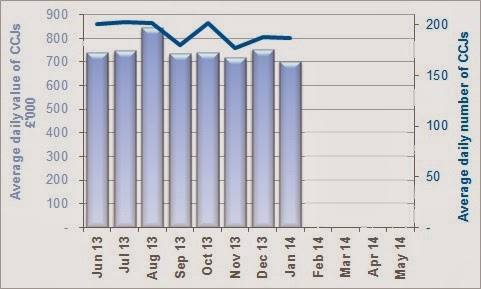
This shows the equivalent graph for individuals and partnerships.